|
|
|||
|
The following is a rudimentary calculation of an error budget for the Paradigm 722 Real Time System. Only the major sources of error are included in the calculation as the purpose of this small effort is to help users understand the data that is presented to them. All too often the statement is made that “the system is not very useful because the Sensor reading is not the same as the Meter reading”. These perceptions are the result of not understanding the bounds on the data and not understanding that it is not the absolutely values that are important, it is the TRENDS that allow better control to be achieved. Sources of Error Primary
Other
Assumptions
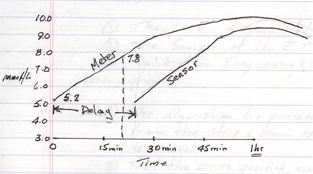
* Please ensure that you have read the Medtronic Fact Sheet entitled “Distinctions between Standard Glucose Meters and Glucose Sensors”. Errors Test Strips for the Link Medtronic Real Time System 20% of 7.0 mmol/L = ±1.4 mmol/L If we combine just these two factors, we can see errors in the range of ± 1.9 mmol/L. Sensor Delay
Therefore, in this example, where the BG is rising the Meter would read 7.8 mmol/L while the Sensor would be reading 5.2 mmol/L. So we can clearly see that we must understand exactly what the current conditions are to understand what the data is telling us. This is not rocket science but may be a bit confusing until you get your head around it. All of this to say that in my mind it doesn’t matter all that much if the Meter reading is a bit different that the Sensor reading. To me the important thing is that you understand the data and what the Sensor is telling you – the TRENDS. I believe that once we understand that, the actual numbers don’t matter much except in gross terms. We can now proceed from dealing with something that has already happened to dealing with something that will happen in the near future. It is a very different mindset from what we have been taught about pumping to date. This is exciting and users that take on the new mind-set will likely derive significant benefits in glycemic control. G. Ross Douglas — July 22, 2006 |
|||